flot_Interacting chart in Chrome with OffiDocs
Ad
DESCRIPTION
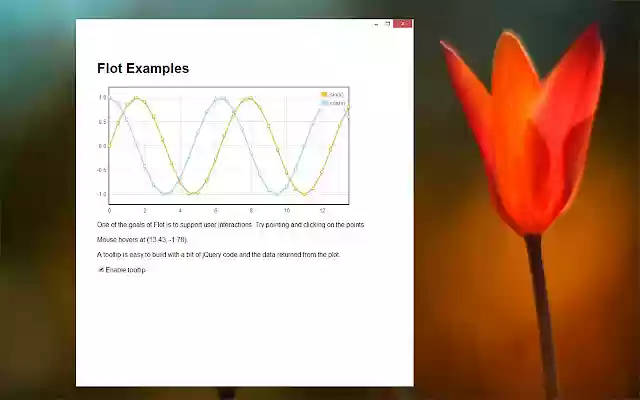
Angular JS/ jQuery/ FLOT JS example This demo shows that FLOTS JS (charting JavaScript library) can be added in your chrome apps.
You need to "sandbox" your html pages in you manifest "sandbox": { "pages": ["MainView.
html"] }, Ref: http://www.
flotcharts.
org/ Ref: http://www.
flotcharts.
org/flot/examples/interacting/index.
html You can find my source code here .
https://drive.
google.
com/folderview?id=0BzFyKq3DBguRUm1lTlVONE5kRnM&usp=sharing
Additional Information:
- Offered by Jean-Marc Flamand
- Average rating : 0 stars (hated it)
flot_Interacting chart web extension integrated with the OffiDocs Chromium online


