Debugger for Adobe Analytics in Chrome with OffiDocs
Ad
DESCRIPTION
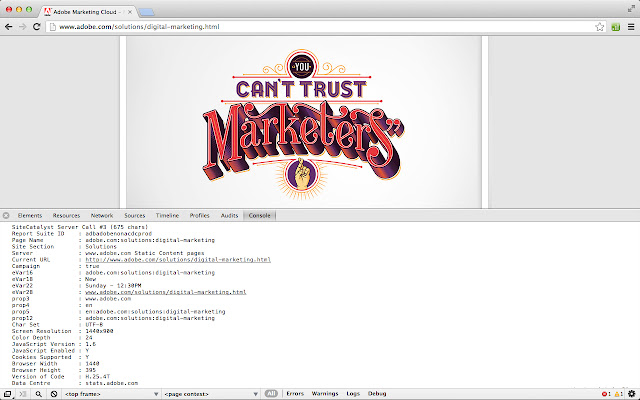
To see what data is being sent in JS console: - On Windows press ctrl+shift+j - On Mac press alt+cmd+j Adobe Analytics Debugger for POST and GET requests.
Prints following info: - displays all page load data, link events, file downloads - shows information about data collection servers and informs if it is an RDC server or not - provides recommendations on how to improve the implementation - displays Adobe Marketing Cloud visitor ID and Adobe Marketing Cloud organisation ID Release Notes v1.4 + super long post calls are not truncating anymore + server calls are now printed in a tab where a request originated + added s.
pageType, s.
zip + fixed URI decoding issues + custom and downloads calls will not show footer (data center, cookies, JS version, library version) v1.3 + very long post server calls are working now! Big thanks to richard.
mueller@newellco.
com for fixing this + added grouping and colours + shows context variables + cookie information - first or third party + shows s.
tnt variable v1.2 + display AMC org ID + provide recommendations v1.1 + showing visitor IDs from vid(s.
visitorID), aid(legacy s_vi cookie), mid(marketing cloud id) + added new RDC domain - Singapore and Pacific Northwest (sc.
omtrdc.
net) + showing list eVars + hidden unimportant data such as browser and screen information + by default the debugger is ON now
Additional Information:
- Offered by Tomas Balciunas
- Average rating : 4.42 stars (liked it)
- Developer This email address is being protected from spambots. You need JavaScript enabled to view it.
Debugger for Adobe Analytics web extension integrated with the OffiDocs Chromium online


